Particulate Matter Sensor (PM1.0 / PM2.5 / PM10) — Principles, Specifications, Applications & Integration Guide
What Is a Particulate Matter (PM) Sensor?
A PM sensor measures airborne particles suspended in air—commonly reported as PM1.0, PM2.5, and PM10, where the number denotes the aerodynamic diameter in micrometers (µm). These fractions are closely linked to health risks, filter performance, and ventilation control. Typical outputs are mass concentration (µg/m³) by size fraction and, on some modules, particle number counts per size bin.
Why PM Monitoring Matters
- Health & compliance: PM2.5 penetrates deep into the lungs; many regions use AQI thresholds based on PM2.5/PM10.
- Smart ventilation & energy: Demand-controlled ventilation and filtration reduce energy while maintaining IAQ.
- Process & facilities: Cleanrooms, data centers, and manufacturing benefit from continuous particle trending.
- Consumer devices: Air purifiers and thermostats use PM feedback for auto mode, filter life estimation, and user-facing IAQ scores.
Sensing Principles
Laser PM Sensors Work
- Illumination: A laser diode illuminates an airflow that passes through a small optical chamber.
- Scattering: Particles scatter light; the intensity and angle follow Mie scattering rules dependent on particle size and refractive index.
- Detection: A photodiode captures scattered light pulses from individual particles.
- Signal processing: Firmware converts pulses to counts per size bin and then estimates mass concentration (µg/m³) using assumed particle density and shape factor.
- Flow control: A micro-fan or convection design stabilizes flow for repeatable readings.
Note: True regulatory mass reference is gravimetric (filter+weighing). Optical PM sensors provide near-real-time estimates with excellent trend fidelity and strong correlation when properly calibrated.
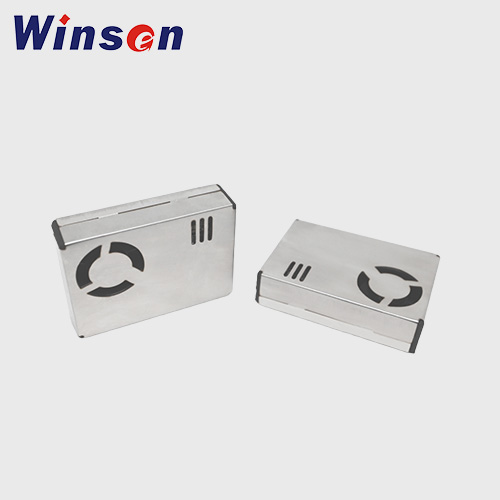
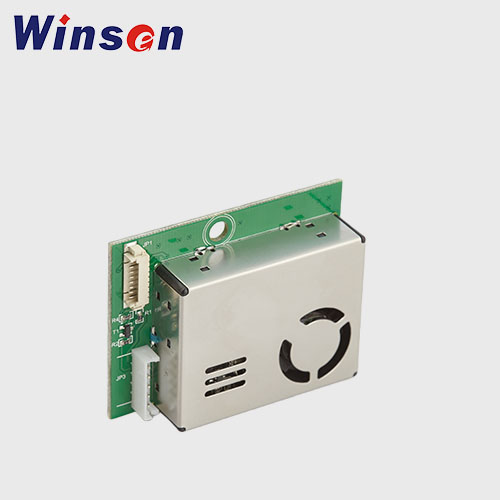
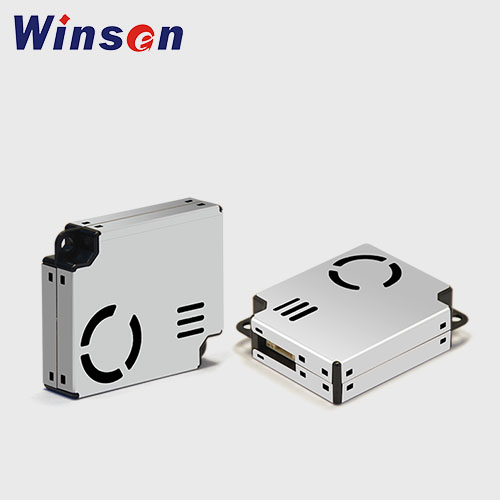
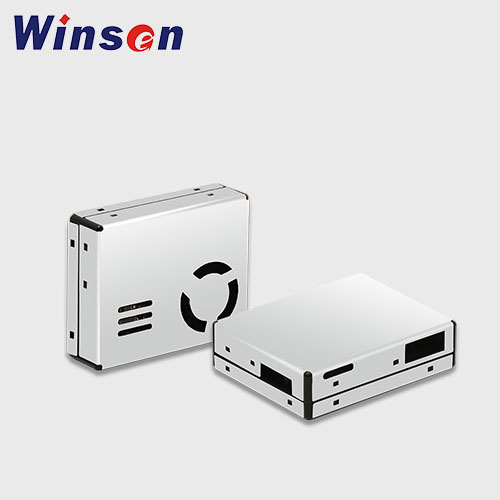
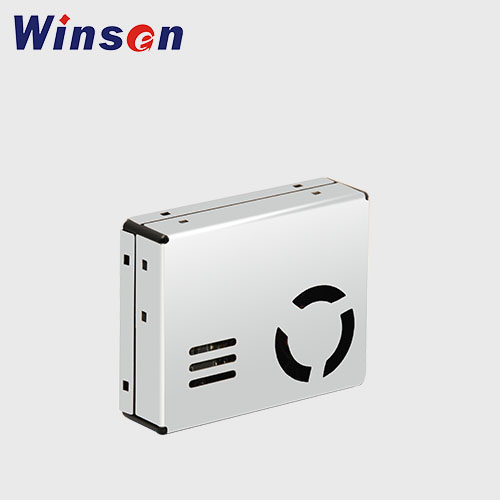
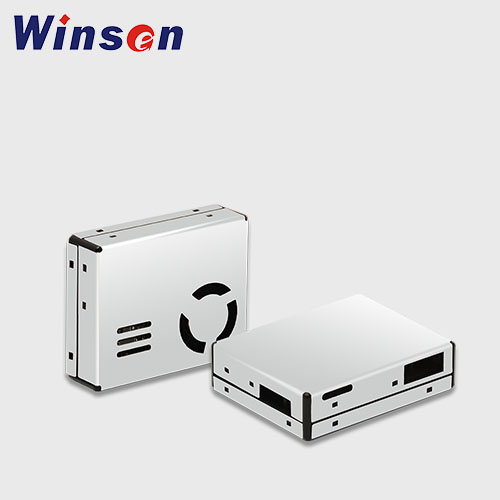
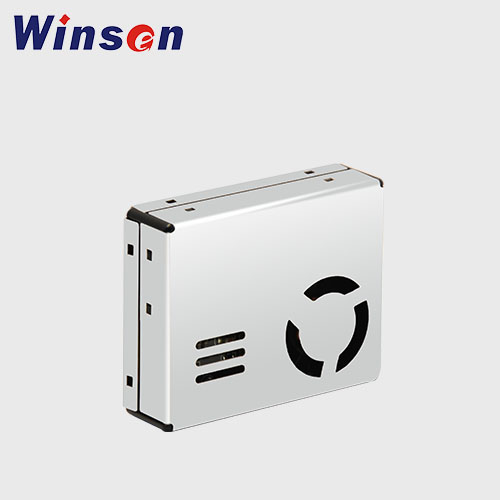
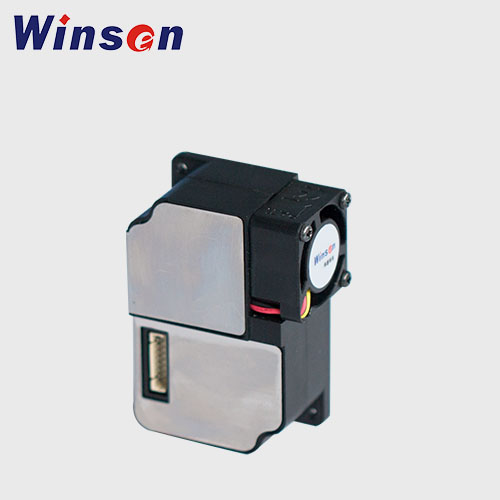
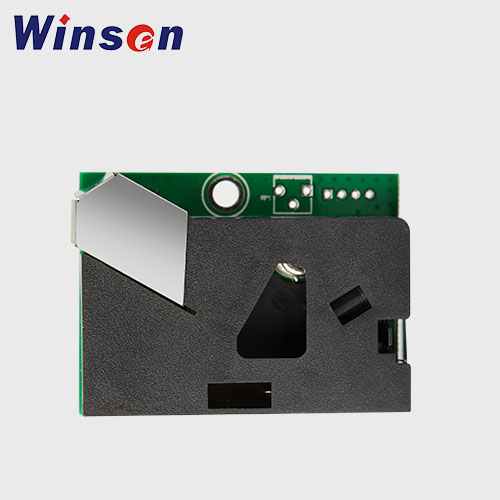
ZH09 Laser dust sensor
- PM1.0,PM2.5,PM10
- 0-100 μg/m³:±15μg/m³ 101-1000 μg /m³: ± 15% Reading (Test Condition: 25 ± 2 ℃, 50 ± 10%RH, Grimm, Cigarette, GBT18801-2015
- Read More
Infrared PM Dust Sensor (IR Photometry)
-
Principle: An IR LED and receiver measure the attenuation/forward scatter caused by particles passing the optical path.
-
Strengths:
Cost-effective and low power
Good for coarser trends and event/threshold detection
Simpler electronics and smaller BOM
-
Best for: Cost-sensitive products, fan controllers, basic wall sensors focused on PM2.5/PM10 trend alarms rather than detailed binning.
Key Specifications You Should Request
- Reported metrics: PM1.0 / PM2.5 / PM10 (µg/m³), particle counts (#/0.1 L or #/L), size bins (e.g., ≥0.3, ≥0.5, ≥1.0, ≥2.5, ≥5, ≥10 µm).
- Resolution / LOD: e.g., 1 µg/m³ resolution; number counts down to 0.3 µm bin where applicable.
- Accuracy / linearity: State as ±(% of reading + µg/m³) over a defined T/RH and aerosol type.
- Repeatability & stability: Short-term precision and long-term drift specs.
- Response time (T90): Typically ≤ 10 s, faster with forced flow.
- Operating window: Temperature (e.g., −10…+50 °C), humidity (non-condensing), pressure altitude.
- Interface & supply: UART / I²C, optional PWM/analog, typical 5 V or 3.3–5 V; fan power profile.
- EMC & approvals: CE/UKCA, RoHS/REACH; design for EN 61326 immunity.
Data Quality, Compensation & Limits
- Humidity effects: Hygroscopic particles grow at high RH, causing positive bias. Use onboard RH/Temp compensation or external inputs.
- Aerosol dependence: Optical response varies with particle composition (smoke vs dust vs salt). For best accuracy, apply field calibration to your use case.
- Low-flow/duct effects: Maintain stable flow. Avoid backpressure or recirculation that causes counting losses.
- Aging & contamination: Dust deposits on optics bias readings—implement self-clean routines (fan bursts), optical design shielding, and maintenance alerts.
Converting Number Counts to Mass (Conceptual)
Mass estimation assumes a particle density ρ (e.g., 1.5 g/cm³ for generic indoor dust) and a shape factor k:
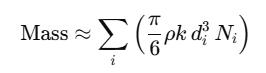
where (d_i) is representative diameter of size bin i and (N_i) is number count. Changing ρ or k shifts mass results—calibrate these if your aerosol is known (e.g., wildfire smoke vs mineral dust).
Applications & Integration Playbooks
1) Air Purifiers & Consumer IAQ
-
Goal: Auto-mode control and user display.
-
Design tips:
- Place the inlet where room air can reach it, not behind obstructions.
- Use debounce filters (e.g., 5–15 s moving average) with rate-of-rise detection for rapid smoke spikes.
- Provide AQI mapping (e.g., US/EU/China standards) and LED color states.
2) Smart Buildings & HVAC/BMS
-
Goal: Demand-controlled filtration/ventilation and IAQ compliance logging.
-
Design tips:
- Use UART/I²C to BMS gateway; log PM2.5/PM10 at 1–60 s intervals.
- Co-monitor CO₂, TVOC, RH/T for robust control and diagnostic context.
- In ducts, adopt isokinetic sampling or bypass with fan to maintain representative counts.
3) Environmental Monitoring (Indoor/Perimeter)
-
Goal: Event detection (e.g., wildfire smoke), community dashboards.
-
Design tips:
- Use weather shields, water-repellent inlets, and insect screens without choking flow.
- Periodically validate against reference stations and adjust aerosol factors seasonally.
4) Industrial & Clean Areas
-
Goal: Particle trend monitoring at lines, warehouses, or near process exhaust.
-
Design tips:
- Install pre-filters in dusty locations to extend sensor life.
- Use alarms (warning/action) with hysteresis and minimum on-time for fans/relays.
Selection Checklist (Copy/Paste into Your RFQ)
- Output format: PM1.0/2.5/10 mass (µg/m³) and/or particle counts + size bins.
- Minimum detectable size: e.g., ≥0.3 µm counting capability.
- Response time (T90) and logging rate.
- Operating window & RH compensation strategy (onboard vs host).
- Interface: UART / I²C / PWM / analog, supply 3.3–5 V, fan power.
- Form factor & mounting constraints; duct probe vs room sensor.
- Calibration plan: reference device, aerosol types, periodic optics check/cleaning.
- Compliance & EMC: CE/UKCA, RoHS; design for EN 61326 immunity.
- Accessories: inlet filters, weather hood, calibration adapter.
Frequently Asked Questions (FAQ)
Q1. How accurate are optical PM sensors vs gravimetric reference?
They correlate well when calibrated to the local aerosol and RH-compensated. For regulatory reporting, a reference method is still required.
Q2. Do I need to heat the inlet?
A mild anti-fog/anti-condensation strategy improves stability in high-RH environments, but keep temperatures safe for plastics and user contact.
Q3. Can I use PM counts directly for cleanroom classification?
Most low-cost optical sensors are not ISO-class instruments; they’re ideal for trend monitoring. Use certified counters for compliance.
Q4. Why do readings spike during cleaning or cooking?
Detergent aerosols and oil vapors scatter strongly. This is expected; use event masks or user prompts during such activities.
Q5. How often should I clean the sensor?
Design for maintenance intervals (e.g., every 6–12 months) or when diagnostics indicate optics contamination or fan faults.
Why Choose Winsen for PM Sensing
- Complete portfolio of laser scattering PM sensors for consumer, commercial, and OEM needs.
- Easy integration via UART/I²C with compact footprints for air purifiers, thermostats, and BMS nodes.
- Engineering support for RH compensation, aerosol calibration, and mechanical airflow design.
- Scalable manufacturing & QA for consistent batch performance across high-volume programs.
Talk to Our Engineers
Share your application, target markets, interface/power, and form factor constraints. We’ll recommend the optimal Winsen particulate matter sensor with evaluation kits, firmware guidance, and mechanical reference designs to accelerate your launch.